Blog
Where am I iOS? (2012-11-07)
Overview
This article is a summary of the world of mobile device GPS accuracy. I have spent quite a lot of time over the past month or so understanding the issues that one faces when dealing with these types of things, as well as the options available to solve them. My hope is to ease the learning curve for those of you who wish to get the most out of your GPS enabled apps. If it is one thing I have learnt from my research; there are certainly more knowledgeable people out there with regards to this topic - so please don't consider this the definitive guide to improving GPS accuracy. Conversely however, I think that much of the public domain material on this topic can be very hard to digest (for me at least; I have comp sci degree, part of which required advanced calculus and vector algebra course completion, however this certainly wasn't my strong suit).
The Problem(s):
This basically boils down to perceived vs. actual data. My device tells me that I'm somewhere, but in reality I'm only close (sometimes not even) to that location. In iOS, the CLLocationManager allows you to specify the level of accuracy that you require for your app; the best of which is kCLLocationAccuracyBestForNavigation, which is essentially the same as kCLLocationAccuracyBest except with some minimal filtering & sensor fusion (I'll explain what these mean shortly) applied. Other than this setting, we have little direct control over the accuracy of our device. If the best isn't good enough, then we have to use our imaginations a little (ahem, well, other people's imaginations more so in this case).
GPS devices have a standard accuracy rating of 10 meters. This can be enhanced slightly (in terms of more rapidly finding your general location more so than actual accuracy, or by substituting a poor GPS signal) with the sensor fusion of wifi & cell tower triangulation. GPS can be a bit more accurate than the standard 10m, in an open field with a clear sky I often find my iPhone 4 can reliably be accurate to a couple of meters when I run the highly scientific test *cough* of standing near the volley ball post in the park next door, recording the coordinates, and matching them up against the Google Maps satellite view. The main problems that GPS devices face with regards to accuracy are
- Operating in areas with out a clear view of the sky and/or large overhead objects like trees and buildings.
- Measuring altitude.
Altitude accuracy was the main reason for my research into this topic; I found that even in optimal GPS conditions, the altitude reading from a GPS could swing 50 meters without actually changing altitude at all. Further more, the altitude accuracy measurement reported by the CLLocationManager would not reflect this swing. The altitude accuracy issue isn't just isolated to iPhones, or mobile devices; but rather all GPS devices. I won't go into why that is here, all you have to know is that GPS is much better at measuring latitude/longitude than it is altitude. Some devices (no iOS devices are currently equipped) are starting to emerge with barometric altimeters, which are generally more accurate at measuring altitude; however much like a barometer, are susceptible to fluctuation of accuracy subject to sudden weather changes. This can be remedied with yet another form of sensor fusion by taking filtered altitude data from the GPS, and using it to keep the barometric altimeter readings in check... I won't get into that here.
The Facts:
Part of solving any problem is to fully understand the nature of it. And what better way to do so than with some data. My goal for this exercise was to improve the accuracy of the iPhone GPS readings in all aspects (horizontally, and vertically) for a general use case (e.g. potentially any non-specific use case). However as I write, I'll try to explain the implications of various things, and hopefully they should jump out as a candidate should you have a specific use case that suits. I wrote a quick iOS app for iPhone to record every single possible type of empirical data that you might be able to describe positioning with; and record that data in an sqlite database. I extracted that info from sqlite into MySQL for further analysis using various other techniques.
In order to model my 'general' use case, I considered 3 different situations that when combined could be summarized as general purpose.
- Optimal GPS conditions (e.g. good weather clear, broad view of the sky), walking a random path in a small area (approx 50x50m) in the park.
- Sub-optimal GPS conditions, walking a predefined route through a series of city blocks among high rises, with plenty of overhead objects such as awnings, traffic lights, wires etc...
- General highway driving conditions, open-air highway at various speeds in a mostly linear direction.
For all 3 scenarios, I tried various combinations of turning off and on wifi, and cellular data (as iPhone location services are assisted by these), as well as randomly holding the device in different orientations (landscape, portrait, upside down etc.) as I was recording the data. In order to gain a good sense of accuracy variation, I aimed for at least 500 records per session. Also, in order to negate caching or anything of that nature, I ensured that a new reading wasn't recorded unless altitude, latitude, or longitude had changed since the previous record. You can download the entire SQL dump of my recordings at the end of this article.
One thing to note with altitude data is that it is Gaussian in its nature. Another way to put this is that it follows a normal distribution. Yet another way to put this is that it fits a bell shaped curve. And yet another way to put this is that more often than not; the altitude readings on average tend towards their actual value. This can easily be seen in these frequency distribution graphs of situation #1 (randomly walking a small area of an open air field). It’s easy to isolate altitude in this situation, as the actual altitude (according to SRTM – which I will discuss shortly) should be close to 37m for all readings. Although somewhat skewed, you can see that most of the readings are close to this value. The presence of wifi and Cellular data don’t seem to have affected the accuracy one way or another, as you would expect with optimal GPS conditions. Gaussian data is a good thing; this shows that the sensor readings adhere to some rhyme or reason. If the data were completely random, much of what is to follow would not be of any practical use.
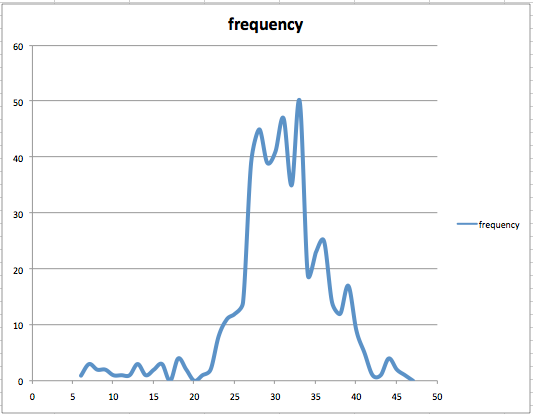 Frequency distribution of altitude in kCLLocationAccuracyBest mode |
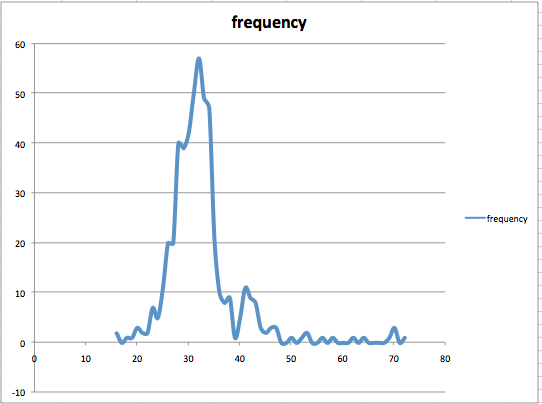 Frequency distribution of altitude in kCLLocationAccuracyBestForNavigation mode |
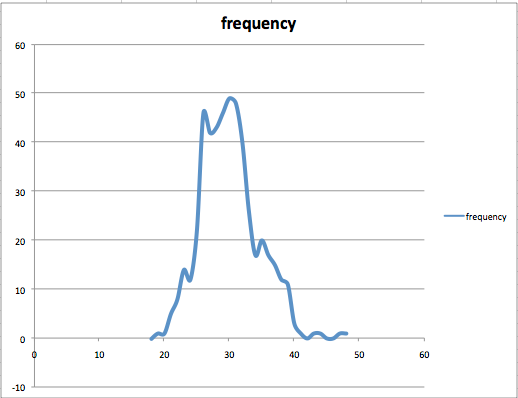 Frequency distribution of altitude in kCLLocationAccuracyBestForNavigation mode with wifi and cellular data turned on |
The Solutions:
SRTM Lookup:
SRTM stands for Shuttle Radar Topography Mission, and was conducted in several rounds by the lovely folks at NASA. The data was collected as the name suggests using a radar antenna from outer space. This is quite a high-resolution topological map of the entire earth (data points for every 10m of North America, and every 90m for the rest of the world). To fill in the gaps between the data points a method known as bilinear interpolation can be used. By cross-referencing this data we can use the more accurate GPS latitude/longitude readings to lookup a reliably accurate altitude. There are a couple of drawbacks to this method though:
- Assumes that your app users will always be on ground level, or at a consistent relative height to ground level
- The data set for the entire world is near 1GB of data, far too much to consider downloading onto a mobile device in a timely manner.
It is distributed as efficiently as it possibly could be in terms of file size. The .hgt files are essentially binary arrays of 16 bit integers with each index in the array representing a real world coordinate – and the value at that index representing the height at that coordinate. They zip up quite nicely however unzipped each .hgt file is around 15MB. To unzip these files and read them into memory would become pretty expensive for most mobile chipsets in an app with any degree of repetition. Not to mention on top of that, the bilinear interpolation calculations to approximate coordinates in between the available data points.
There are a couple of solutions to these problems though:
- You can add a UI element to your app that allows your users to toggle whether they are currently at ground level (assuming your users may conceivably be using your app otherwise).
- You can leverage the Google elevation service to efficiently sift through the mass of elevation data and receive an altitude within a few milliseconds of providing a latitude/longitude coordinate (assuming users of your app will have an Internet connection).
Google takes care of the bilinear interpolation to fill in the gaps, and from my experience – the Google data is almost identical to the SRTM data. Each device is entitled to 2500 free lookups per day with the elevation service, which for practical purposes is about an hour of altitude accurate app time per day. The code for a basic iOS elevation lookup can be found below:
...
NSURLRequest *theRequest=[NSURLRequest requestWithURL:[NSURL URLWithString:[NSString stringWithFormat:@"https://maps.googleapis.com/maps/api/elevation/json?locations=%f,%f&sensor=true",lat,lon]] cachePolicy:NSURLRequestUseProtocolCachePolicy timeoutInterval:60.0];
NSURLConnection *con=[[NSURLConnection alloc] initWithRequest:theRequest delegate:self];
...
-(void)connectionDidFinishLoading:(NSURLConnection *)connection{
NSString *s = [[NSString alloc] initWithData:conData encoding:NSUTF8StringEncoding];
NSDictionary *d = [s objectFromJSONString];
if([[d objectForKey:@"status"] isEqualToString:@"OK"]){
NSNumber *n = [[[d objectForKey:@"results"] objectAtIndex:0] objectForKey:@"elevation"];
actual_altitude = [n doubleValue];
}else{
actual_altitude = gpsAlt;//if elevation service fails, revert to gps alt value
}
}
Filtering (in order of simplest to most complicated):
As I noted above, GPS sensor data adheres to a Gaussian distribution. This makes it suitable for numerous filtering techniques that can smooth out the glitches in our GPS readings. These images below with the blue paths represent the actual path taken for each of my 3 situations.
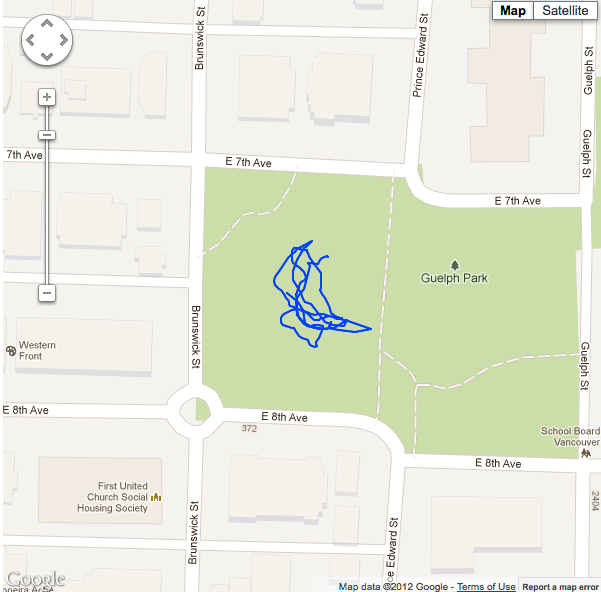 Actual coordinate path of situation #1. |
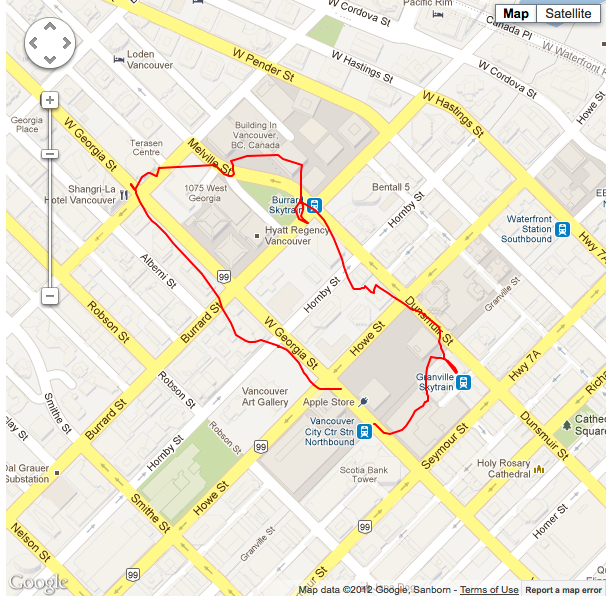
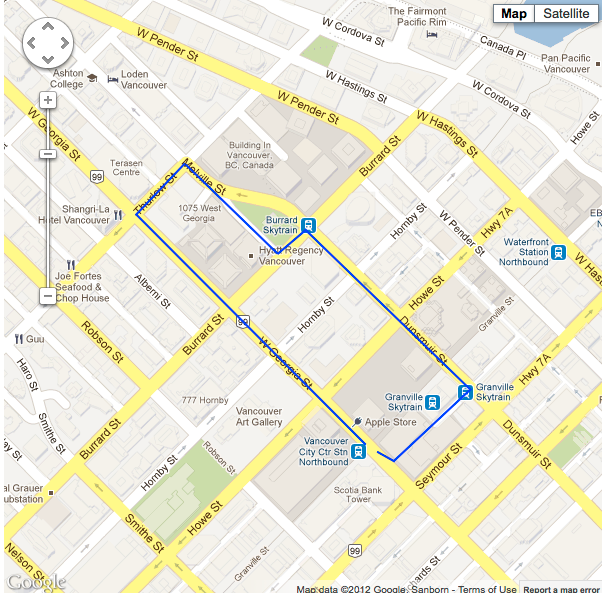 Actual coordinate path of situation #2. |
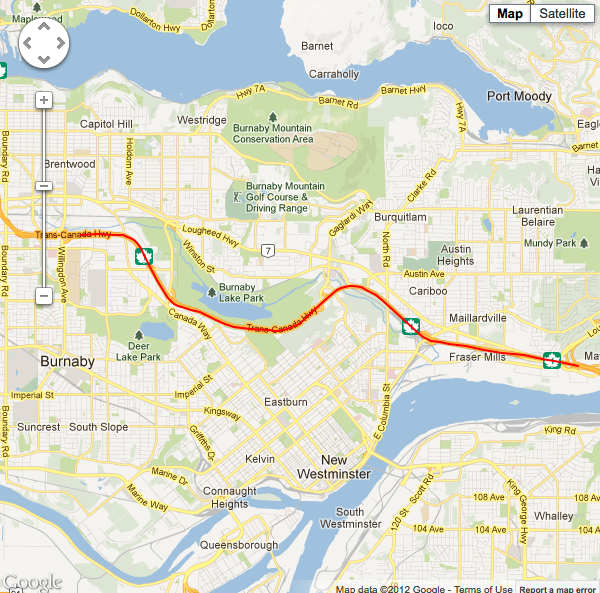
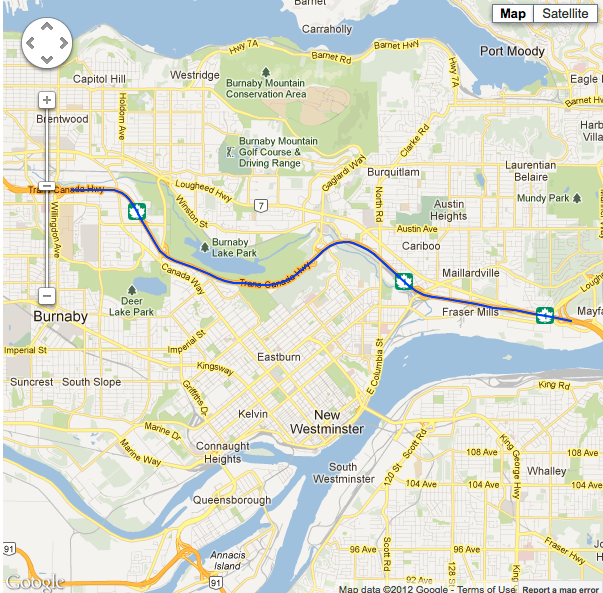 Actual coordinate path of situation #3. |
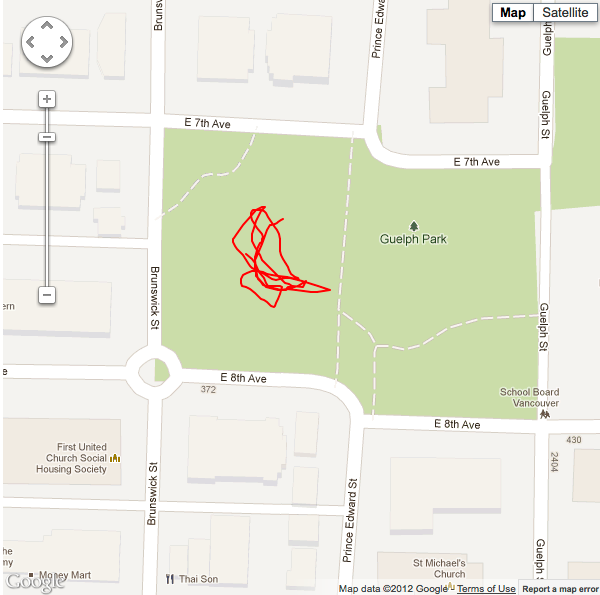
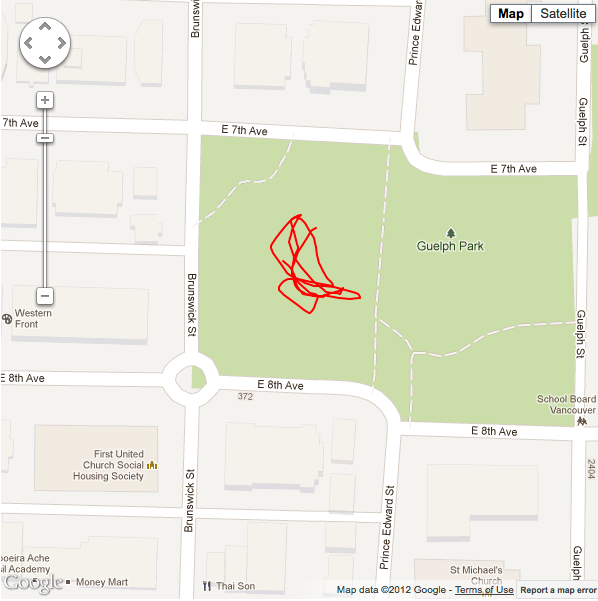
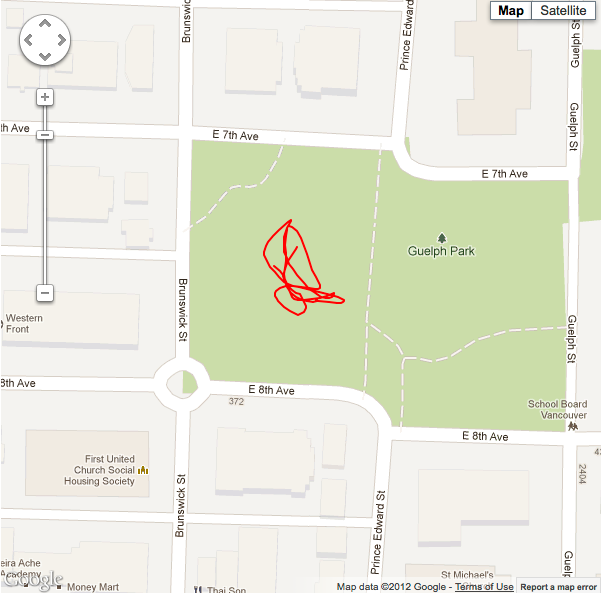
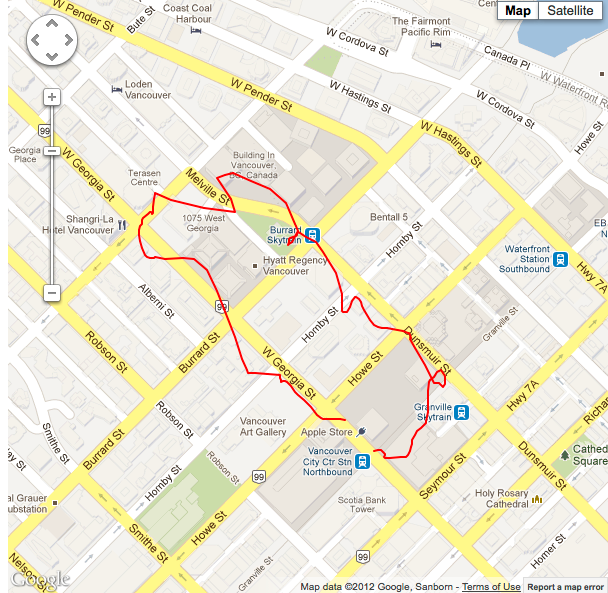
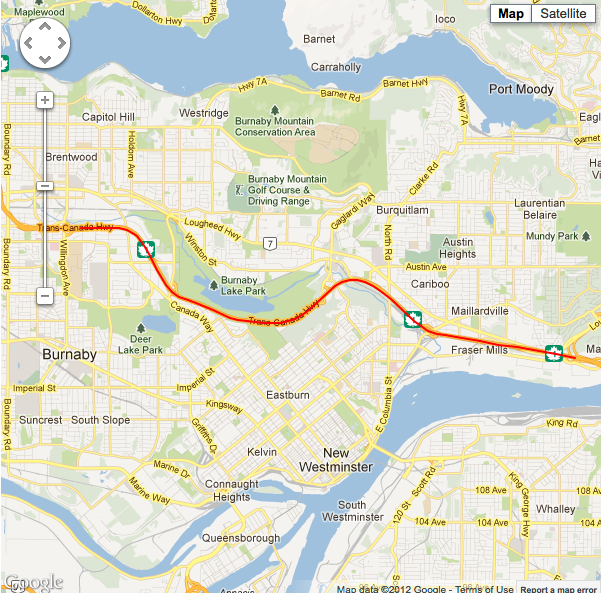
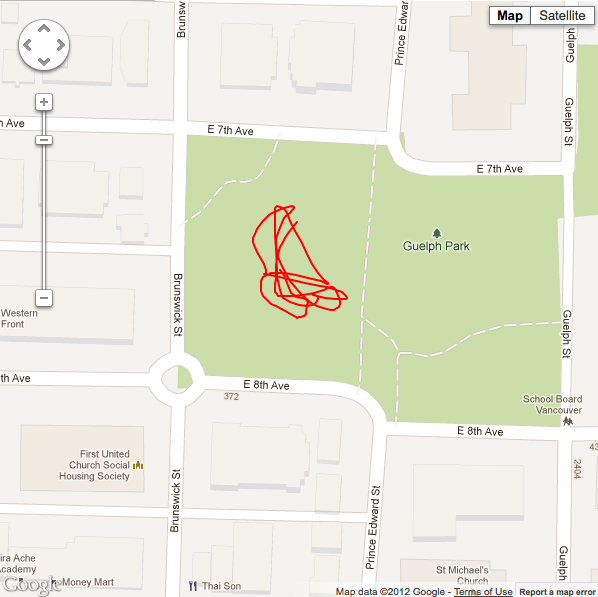
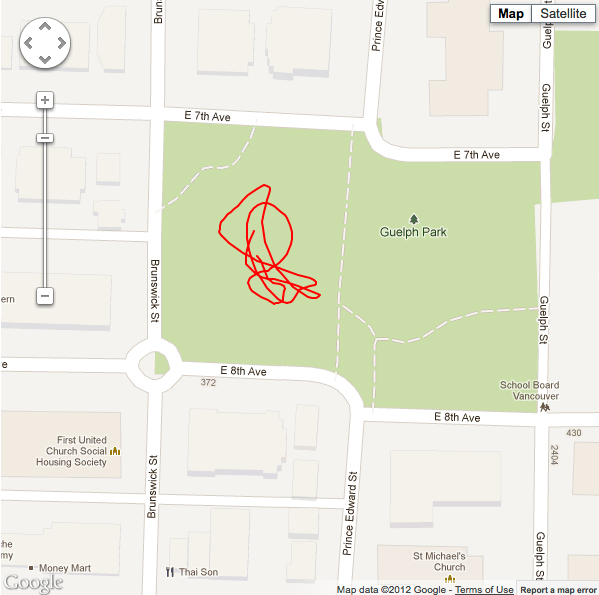
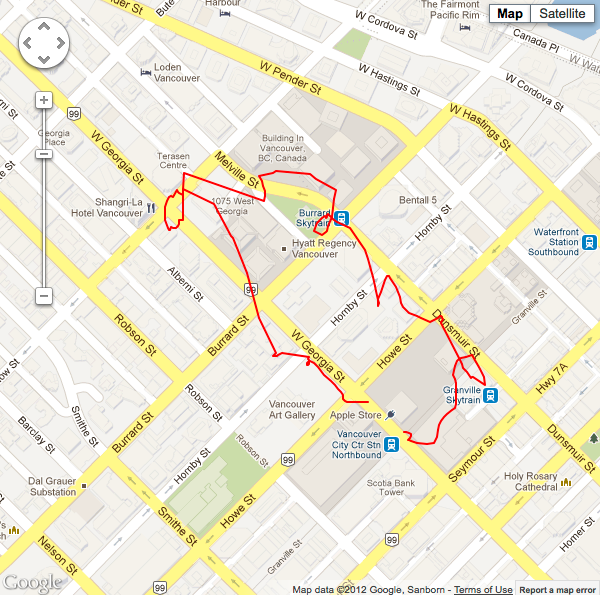
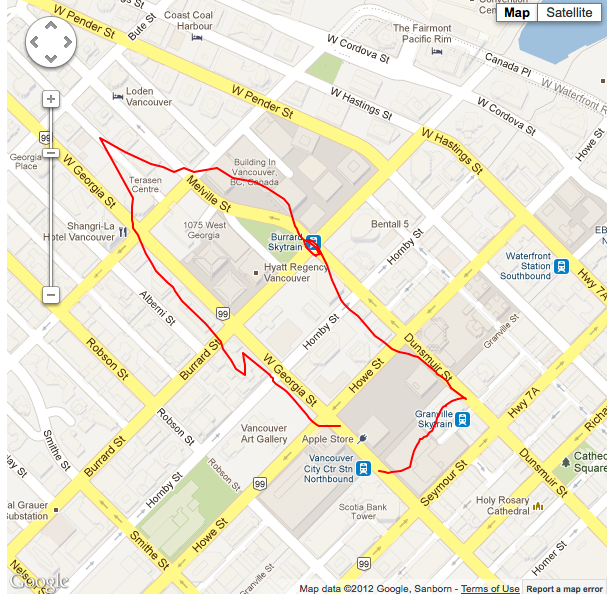
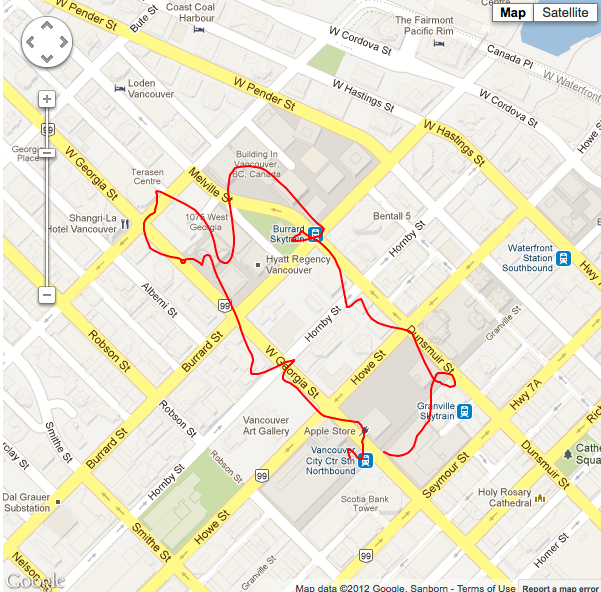
These images below with the red paths represent what the GPS sensor recorded in terms of un-filtered GPS data. As you can see, situations 1 and 3 have good horizontal accuracy; so much of the filtering methodology to follow will be mostly applicable to situation 2. However, it will be interesting to see if any of the filtering methods below degrade the already good signal in situations 1 and 3.
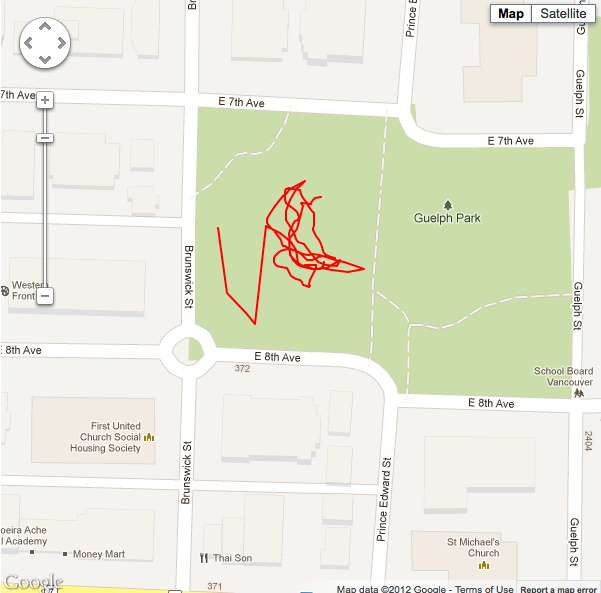 Raw coordinate path of situation #1. |
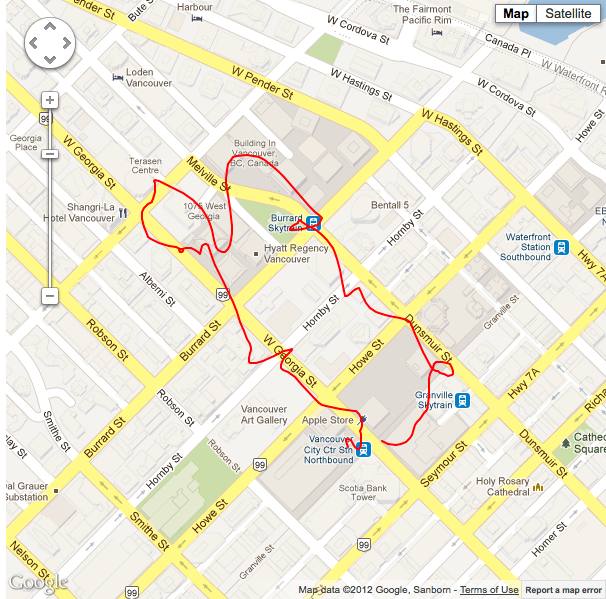
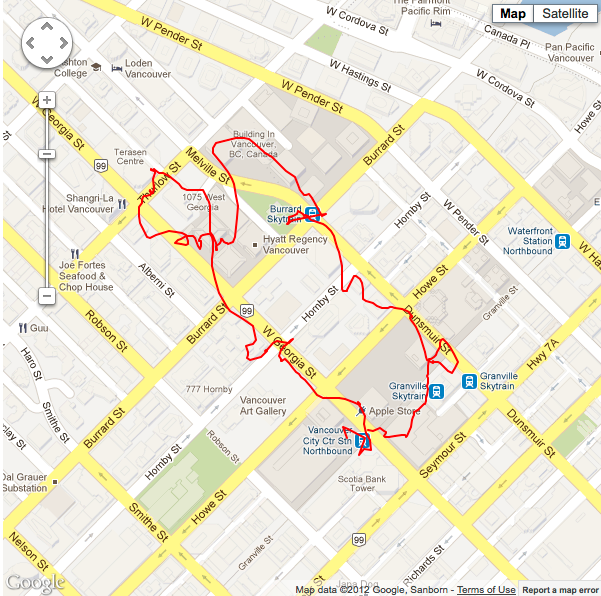 Raw coordinate path of situation #2. |
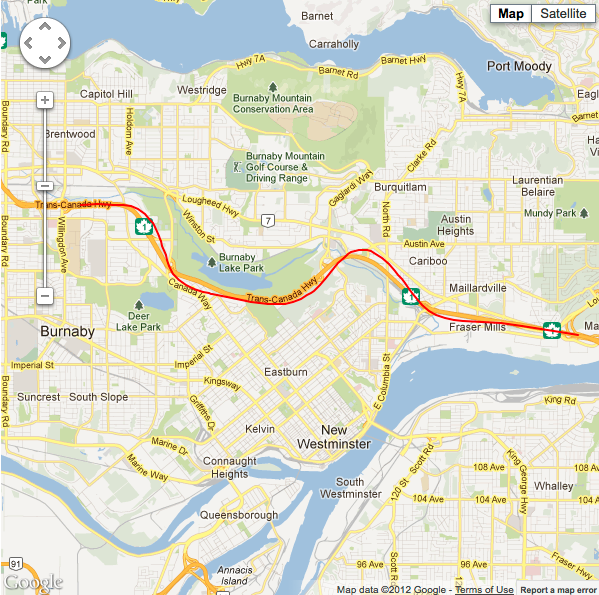
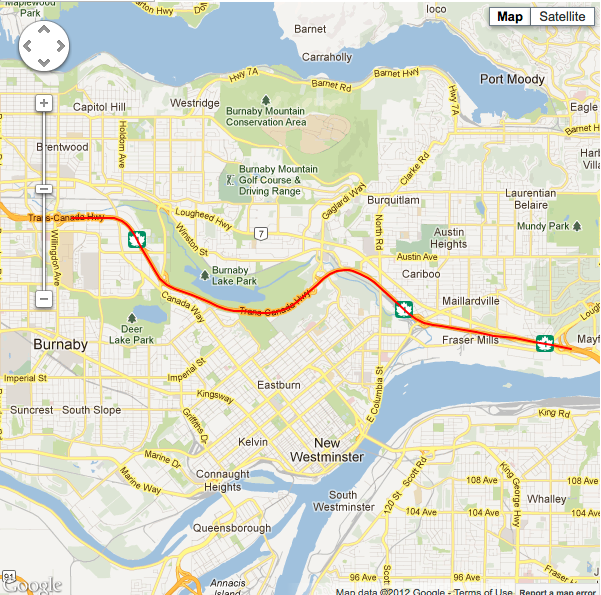 Raw coordinate path of situation #3. |
Running Average:
This method follows the assumption that more often than not, the sensor data will tend towards an accurate reading (because its Gaussian). If we take an average of the whole GPS session, in we’re just going to end up with one point in the middle of where we’ve been most of the time for this GPS session (not really useful in most cases). However if we maintain a running average of x amount of points; where x is the number of points retained in a queue (e.g. first point onto the queue is the first point to be removed from the queue when it reaches its maximum capacity of x), it might smooth out our sensor data to where we actually were with the device for a given GPS reading. If the larger the queue size (to an extent, as mentioned; averaging the whole session isn’t going to do us much good) results in a more accurate path, the trade off here is accuracy vs. responsiveness. If your queue size is 40, and you’re taking a GPS reading and adding it to the queue every second, then its going to take around 20 seconds before the current location data has a significant impact on the location based information being shown to your app user.
Running Average with accuracy threshold:
In addition to physical coordinate data, the CLLocationManager also dishes out a rating as to how accurate the current reading is. If you take the same running average method, and omit from our queue all of the readings we know are going to be inaccurate, then we should be able to get the line even closer to its actual path.
 Situation #1 running 5 point average, minimum horizontal accuracy threshold of 11m, with cellular data and wifi turned on. |
 Situation #1 running 10 point average, minimum horizontal accuracy threshold of 11m, with cellular data and wifi turned on. |
 Situation #1 running 20 point average, minimum horizontal accuracy threshold of 11m, with cellular data and wifi turned on. |
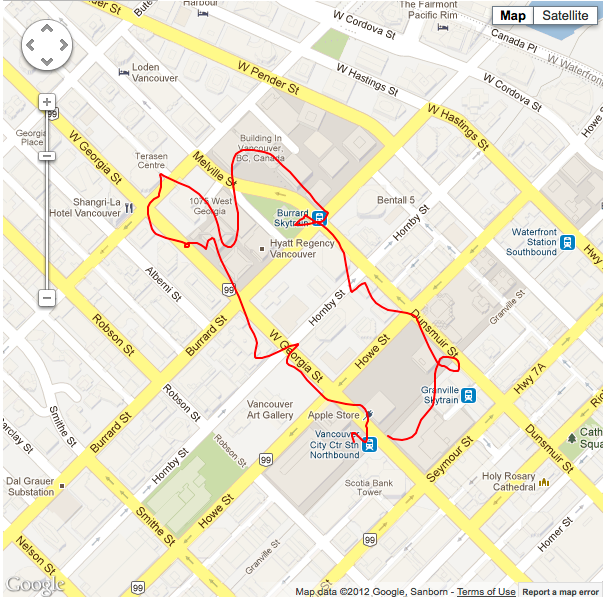
 Situation #2 running 5 point average, minimum horizontal accuracy threshold of 11m, with cellular data and wifi turned on. |
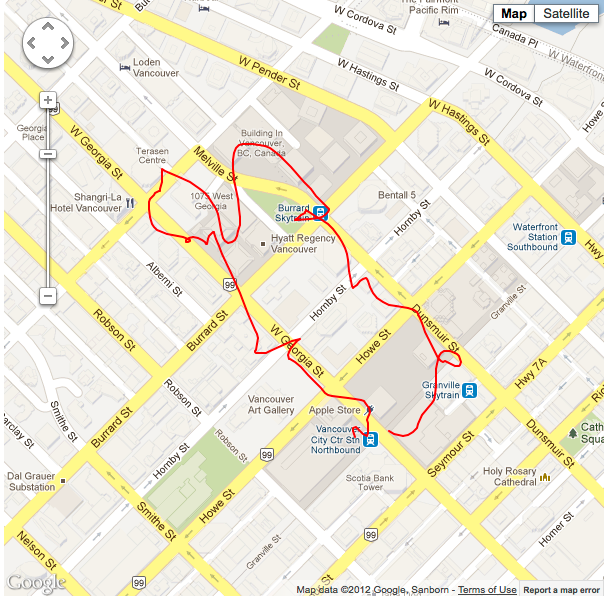
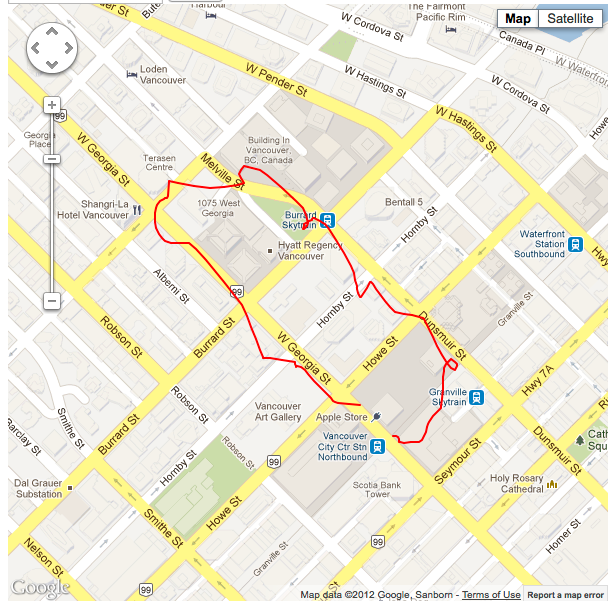 Situation #2 running 10 point average, minimum horizontal accuracy threshold of 11m, with cellular data and wifi turned on. |
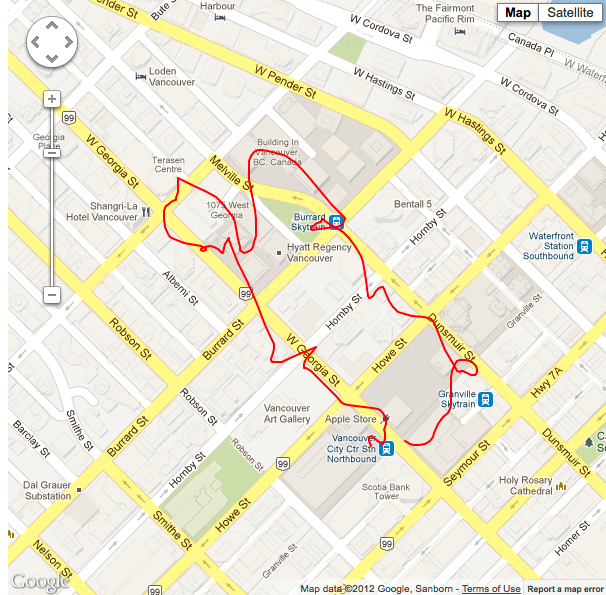
 Situation #2 running 20 point average, minimum horizontal accuracy threshold of 11m, with cellular data and wifi turned on. |
 Situation #3 running 5 point average, minimum horizontal accuracy threshold of 11m, with cellular data and wifi turned on. |
 Situation #3 running 10 point average, minimum horizontal accuracy threshold of 11m, with cellular data and wifi turned on. |
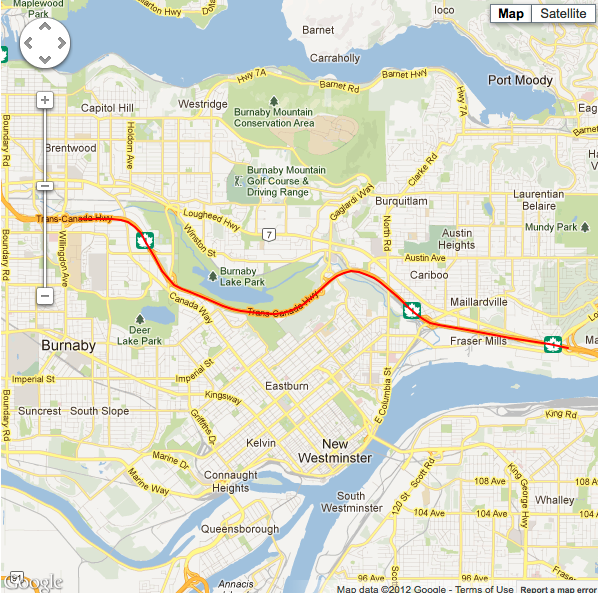 Situation #3 running 20 point average, minimum horizontal accuracy threshold of 11m, with cellular data and wifi turned on. |
As you can see (especially in situation #2) the path draws even closer to its actual value. Conversely responsiveness may be aversely affected even further with this method though, as we are holding out longer for only the most accurate readings. Perhaps it may be acceptable to display an 'obtaining location...' type activity indicator to your app users to express this when they are waiting for a more accurate reading.
Linear Least Squares Method:
Visually speaking, this can be summarized by the line of best fit graphic below.
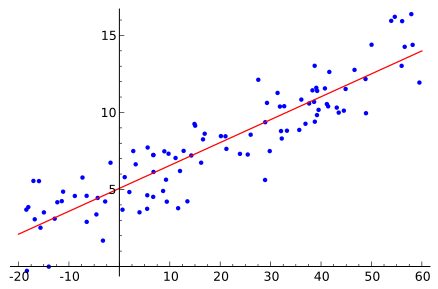 Scatter graph with LLSQ line of best fit. |
This method works under the assumption that we have something that is quite constant for which we take measurements for at various intervals. We expect those measurements should be linear, but recognize there may be some error in our measurements. In this case I am considering the time that a GPS reading was taken at as the constant element, and the GPS reading the element that should be linear however may contain measurement errors. Therefore, we are considering how GPS readings change over time; in the case of the above scatter chart, we could find the line of best fit for GPS readings over time.
This method only handles two variables at a time (x & y) (well at least my implementation of it anyways), and one of those (x) is time; so this means that we have to separate latitude, longitude, and altitude from each other, and find the line of best fit for all of them as they progress over time. As you may recall from your high school math, a linear graph has the equation y = ax + b; in this situation we’re trying to find 'a' and 'b' (y is latitude, longitude, or altitude, and x is the current time). I won’t get into the math here, but you can look at my code (see the end of this article) for calculating this, which should make the solution more obvious for the programmers out there. We can see the effects of the LLSQ approach below with various situations and configurations. Similar to the running average, I have maintained an iterative, limited sample set of points.
 Situation #1 running 20 point sample LLSQ, minimum horizontal accuracy threshold of 11m, with cellular data and wifi turned on. |
 Situation #1 running 40 point sample LLSQ, minimum horizontal accuracy threshold of 11m, with cellular data and wifi turned on. |
 Situation #1 running 80 point sample LLSQ, minimum horizontal accuracy threshold of 11m, with cellular data and wifi turned on. |
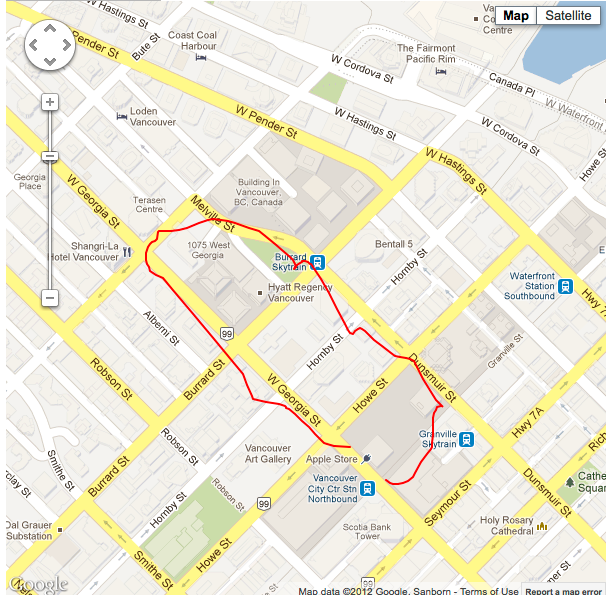
 Situation #2 running 20 point sample LLSQ, minimum horizontal accuracy threshold of 11m, with cellular data and wifi turned on. |
 Situation #2 running 40 point sample LLSQ, minimum horizontal accuracy threshold of 11m, with cellular data and wifi turned on. |
 Situation #2 running 80 point sample LLSQ, minimum horizontal accuracy threshold of 11m, with cellular data and wifi turned on. |
 Situation #3 running 20 point sample LLSQ, minimum horizontal accuracy threshold of 11m, with cellular data and wifi turned on. |
 Situation #3 running 40 point sample LLSQ, minimum horizontal accuracy threshold of 11m, with cellular data and wifi turned on. |
 Situation #3 running 80 point sample LLSQ, minimum horizontal accuracy threshold of 11m, with cellular data and wifi turned on. |
The main advantage to this method is that unlike the running average, you end up with a formula that describes your current path, so if you loose signal for a while, you can predict where you might be had you continued on that path. Like the running average, you can also obtain a normalized value for the current GPS location.
The main disadvantage of this method (depending on your use case) is that it’s linear. If your app users are likely to be heading in curved directions, or changing directions, you’ll probably run into problems. If you consider the results above you can see lines become more jagged and pointy (in the case of noisy data - e.g. situation 2), or more inaccurate (in the case of optimal GPS conditions - e.g. situations 1 & 3) where they shouldn’t be (especially with larger sample queue sizes).
Non-Linear Least Squares:
Sorry guys, this is where things start to get over my head mathematically. I’ll attempt to explain it though nonetheless. So, one possible disadvantage of the LLSQ method I just described was that it assumes travel in a linear direction, which often isn’t the case in the real world; perhaps a parabolic, spherical surface, or saddle surface trajectory would more accurately describe things for you. There is lots of info out there on this stuff, but basically it relies on being able to come up with an equation (e.g. y = ax + b from the previous example) to describe your ideal line (that is your current path). In addition to that, there are various implementations of this that can handle multiple variables at once. However the general mathematics is also much more involved. Consequently I have no findings to show for this, but wanted to raise it as a valid option.
Regardless however, one would assume that this would fall victim to the same issue as LLSQ. We might be traveling in a parabolic path right now, but perhaps shortly we are about to change into a cubic path, or a saddle surface path. In either case, the only way I can see this being applicable to a real world general use case, is to use some dynamic formula calculation method. Perhaps we use the running average in conjunction with some sort of curve fitting algorithm to find an path equation to describe the current sample set; and then update that path equation iteratively as we update the sample set.. I dunno.
Extended Kalman Filter:
From what I can gather, this is the holy grail of GPS sensor filtering. Similar to the LLSQ, and NLLSQ methods, it follows an observe/predict iterative approach. Other than that though, there’s not a lot I could explain that hasn’t been done so in a more eloquent fashion already. I read dozens of explanations on this thing, and found these two resources (TKJ Electronics and Siggraph Course Pack) to be the most practical. After many hours, I still wasn’t making any real progress on understanding this thing. The math is more complicated than the NLLSQ, as well as there is a bunch of configuration/tweaking to consider. That isn’t to say that I couldn’t figure it out eventually (dreams are free).
In the end however I decided my time would be best spent not re-inventing the wheel, and sought out an existing code library. My main requisite was that the code library be of the C family of programming languages (e.g. C, C++, or Objective-C), so that it could easily be included in an xCode iOS project (converting from one language to another would likely involve learning the math behind this behemoth). There are a few C family libraries out there (KFilter, easykf, Bayes++), however all of these were pretty general purpose (e.g. not honed on the GPS problem) and assumed a solid knowledge of the underlying theory in order to configure them to a specific purpose. I eventually landed on a git hub repository named lacker ikalman written by Kevin Lacker; that is written in C, touted as iPhone friendly, and that is specifically built for GPS data. Unfortunately it doesn't take altitude into consideration, however I’m happy with the Google elevation service lookup as a hybrid solution, if I can successfully filter the latitude/longitude data to key it with. You can download my C app to see how I interfaced with this library (main.c is written by me, everything else is Kevin's). It runs on a *nix based system (with gcc installed) with the following commands:
make kalman.o
make matrix.o
make main.o
gcc -std=c99 -lm gps.o kalman.o matrix.o main.o -o main.out
./main.out
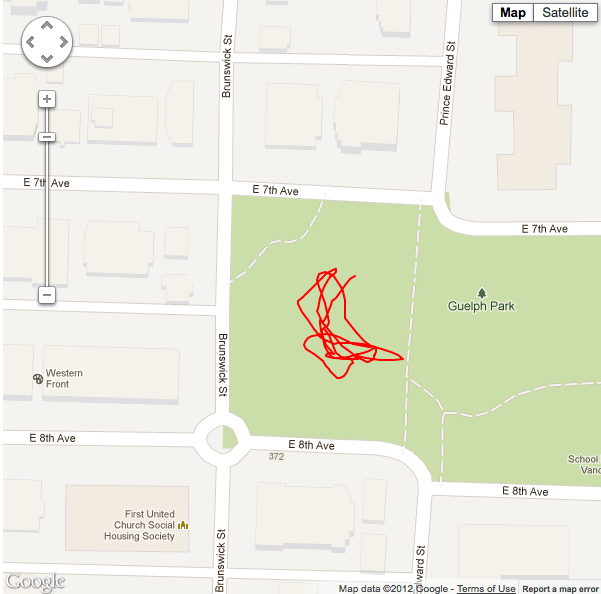
This will read in a CSV file of my test location data; and spit out Kalman prediction data for those same locations in SQL statements designed to update the klat and klon fields in my SQL table structure. You can see the results below.
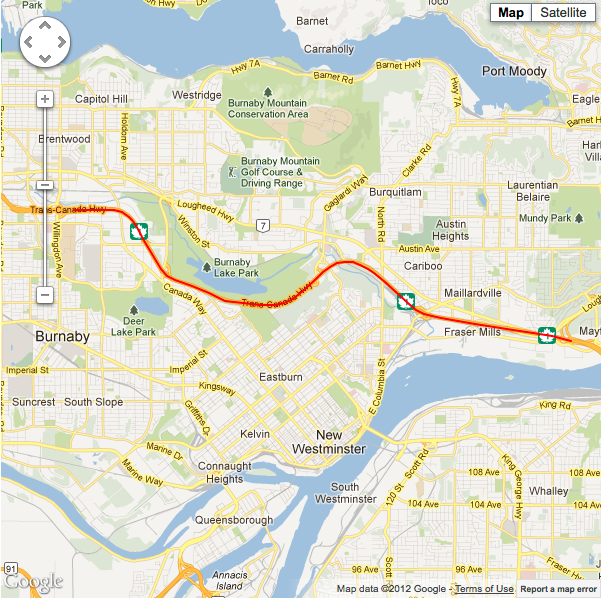
 Situation #2 with the lacker ikalman filter applied at noise level 1.0, wifi and cellular data are turned on. |
 Situation #2 with the lacker ikalman filter applied at noise level 2.0, wifi and cellular data are turned on. |
 Situation #2 with the lacker ikalman filter applied at noise level 10.0, wifi and cellular data are turned on. |
 Situation #2 with the lacker ikalman filter applied at noise level 50.0, wifi and cellular data are turned on. |
 Situation #2 with the lacker ikalman filter applied at noise level 200.0, wifi and cellular data are turned on. |
I’m sure something must be missing from the puzzle here, as you can see the results are pretty much the same as the un-filtered data; which isn’t something you’d expect from the Holy Grail. If you think I’m missing something here, please let me know at reece [at] reecegriffin [dot] com.
Update: I've contacted Lacker about the ikalman filter. He stated that despite the test use case for GPS data, the ikalman filter is not optimized for general GPS usage.
Summary
In conclusion, my current choice for GPS accuracy improvement is to use CLLocation's kCLLocationAccuracyBestForNavigation accuracy setting, in conjunction with a 20 point running average of latitude, longitude and altitude; with a minimum accuracy threshold of 11 meters (e.g. only considering GPS readings that report having an accuracy of 11 meters or less). In addition I will add a toggle to my app where users can specify if they are currently at ground level or not. If so, and if an internet connection is present: I will query the Google elevation service with the filtered latitude and longitude values, to obtain the altitude. If not, I will simply use the filtered altitude value from the running average. This blog article is still a work in progress. It is my expectation that there is much improvement to be made with regards to filtering techniques; particularly with the non-linear least squares & and extended Kalman filter methods. I will update this article if/when I can master more of these. For a repository of all code used for this exercise, see below...
- GPS Data collection Tool (xCode project)
- All Collected GPS Data (.sql file for MySQL)
- Altitude Frequency Distribution Charts (MS Excel Files)
- Google Maps Point Plotting for Running Average (.jsp file)
- Google Maps Point Plotting for Linear Least Squares (.jsp file)
- Implementation of the Lacker Kalman filter (C application)